Cash Flow: What’s Remains After Growth
Profit Is Not the Same as Cash Flow
There can be significant differences between profit and cash inflow. Revenue is sometimes recognized before payment is received, and inventory must be pre-financed. Stock-based compensation reduces profit without an immediate outflow of cash.
Free cash flow—operating cash flow minus capital expenditures—shows how much money is available for dividends, share buybacks, debt repayment, or acquisitions. However, even this metric is not an unadulterated “fact”: payment schedules, supplier financing, and changes in working capital can temporarily affect it. That is why we examine its trend over a longer period of time.
When Negative Cash Flow Becomes a Warning Sign
Negative free cash flow isn’t necessarily a bad thing. When a company invests in new capacity, it spends money today to generate higher earnings in the future. The key factor is whether the expected return is reasonable and whether the company can financially bridge the gap until the investment pays off.
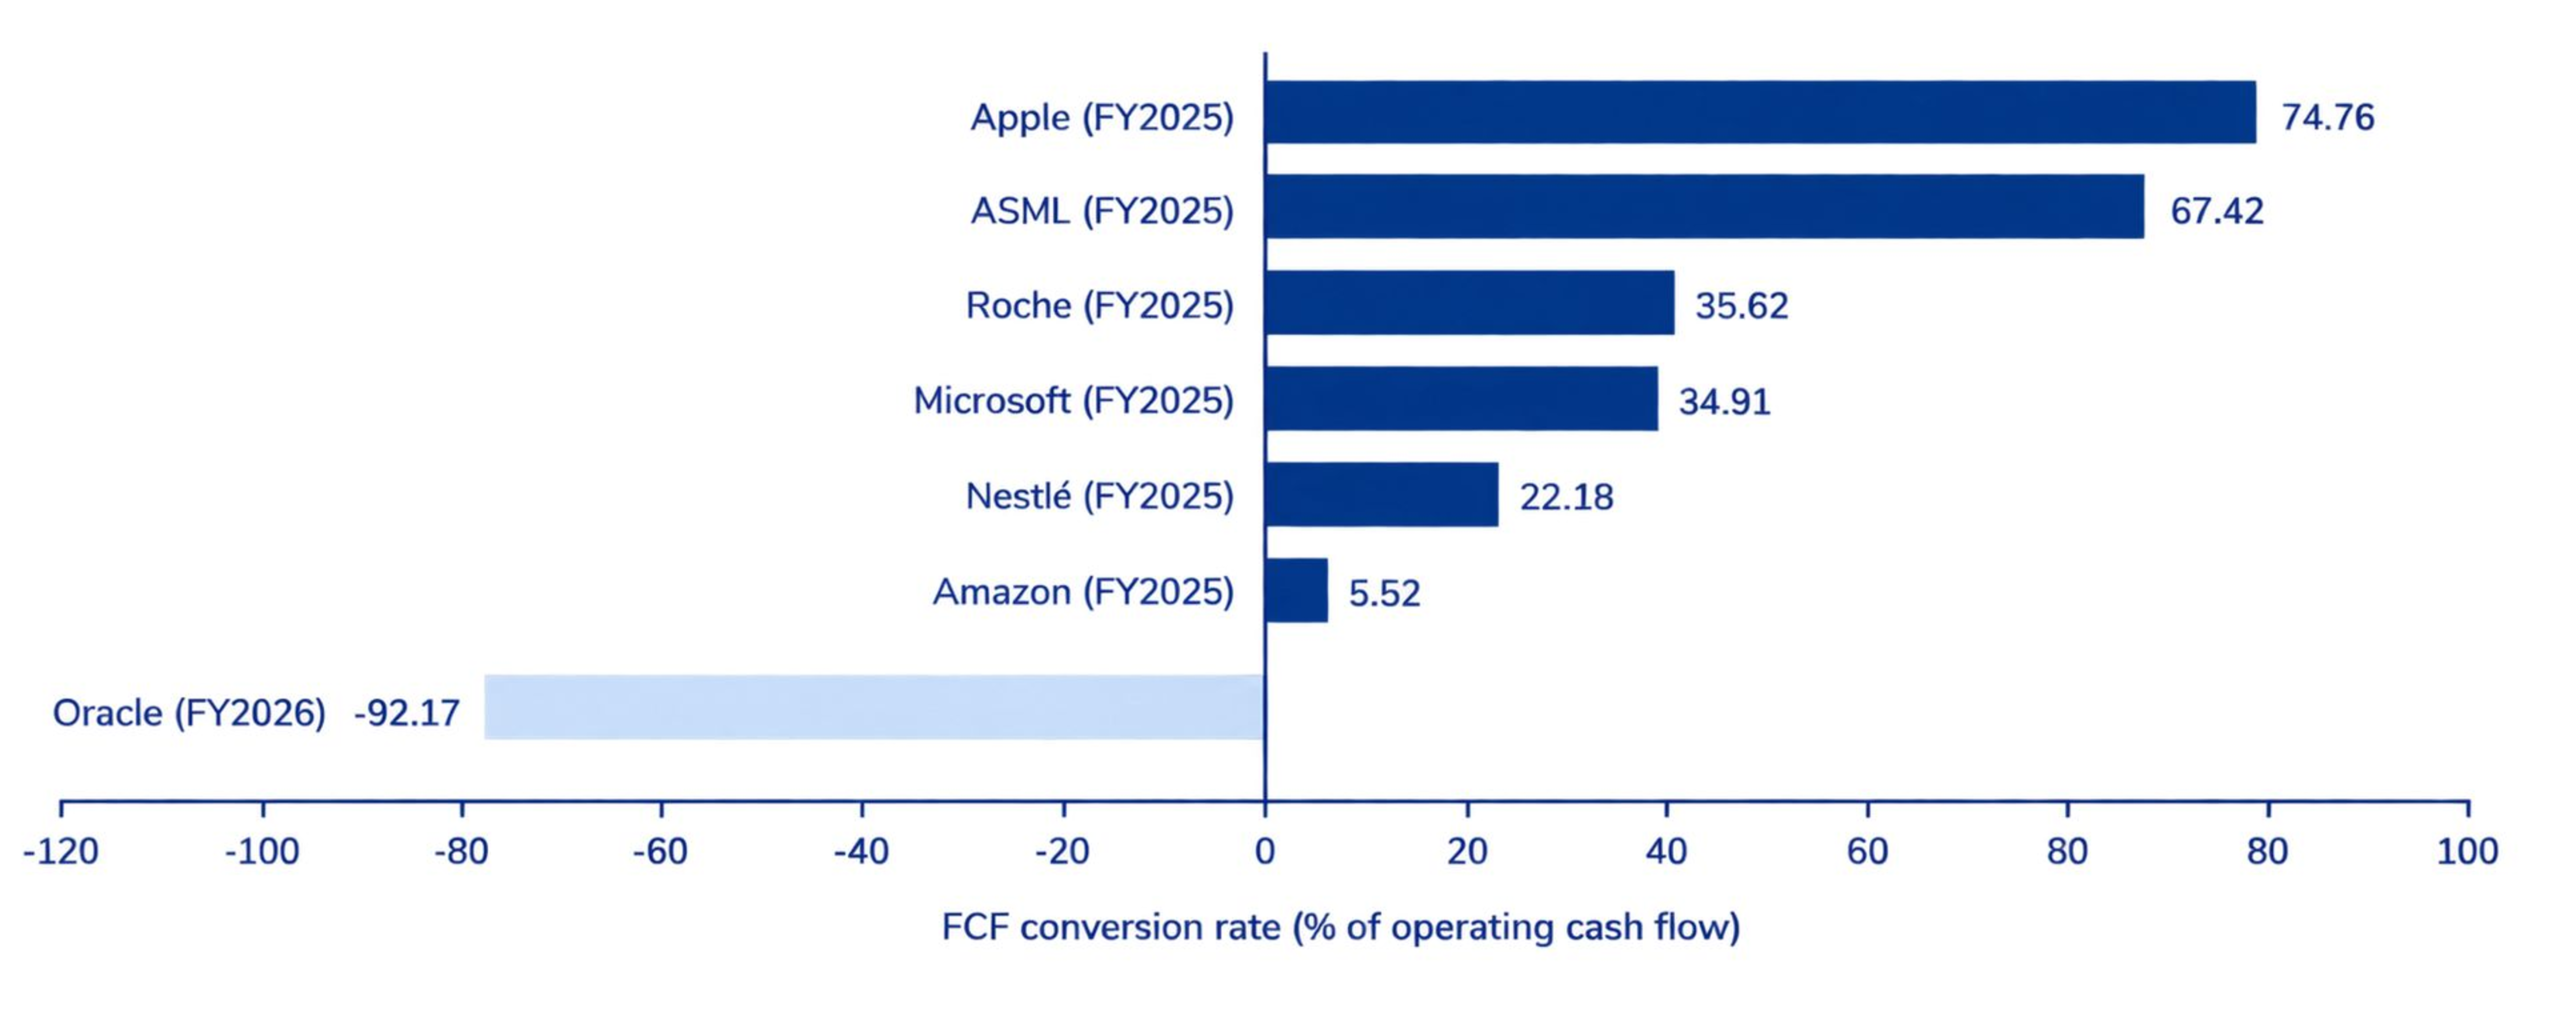
A recent example outside our portfolio is Oracle. The company illustrates why we are cautious in the face of sharply rising capital expenditures, negative free cash flow, and increasing debt. In fiscal year 2026, capital expenditures rose to approximately USD 56 billion, while operating cash flow totaled just under USD 32 billion. As a result, free cash flow was negative by approximately USD 24 billion.
At the same time, Oracle paid out nearly $6 billion in dividends and largely suspended its share buybacks. The funding gap was closed, in part, by taking on new debt. In July, S&P lowered the credit rating to BBB‑, the lowest level within the investment-grade range.
This is offset by an order backlog of USD 638 billion. Demand is evident, but the resulting cash flow is largely in the future. If projects are delayed or returns fall short of expectations, high debt and long-term obligations will persist. As long as it remains unclear how quickly the order backlog will translate into cash flow and to what extent debt will continue to rise, we are refraining from investing.
What We Look For
During capital-intensive growth phases, we examine four key points: Is operating cash flow growing in line with revenue? What return do the newly invested funds generate? Can investments be financed with internal resources? And how resilient will the balance sheet remain if cash inflows are delayed?
Therefore, it is not only the investments themselves that are decisive, but also their financing and the quality of the financial statements.
Share Buybacks: It’s All About the Number of Shares
Many companies compensate employees in part with shares. This can dilute the stakes of existing shareholders. Buybacks only create added value if they more than offset this dilution and the number of shares actually decreases.
At Apple, the diluted number of shares fell by about 2.6% in 2025. At Microsoft, it remained largely stable despite high buybacks because a significant portion offset stock-based compensation. At Amazon, it rose slightly. For shareholders, what matters is not the media-friendly buyback amount, but whether their economic stake in the company is growing.
What this means for our portfolios
Our portfolios combine different cash flow profiles. Companies such as Nestlé and Roche have established business models and generally finance their dividends from ongoing cash inflows. In the case of Microsoft, Amazon, and other beneficiaries of AI expansion, we accept higher levels of investment but continuously monitor whether revenue, operating cash flow, and return on capital are growing in tandem. In the case of Oracle, we do not currently see these criteria being sufficiently met and are therefore not invested in the company.
Apple demonstrates how high free cash flow can benefit shareholders through share buybacks. As equipment suppliers, ABB, Schneider Electric, and ASML are benefiting from the investment boom without having to finance the data centers themselves. We assess banks and insurance companies separately: for these sectors, capital generation, regulatory capital ratios, and solvency are more meaningful indicators than traditional free cash flow.
What matters to us is not whether free cash flow declines in a single year. We want to understand why it is declining, what returns the investments are expected to generate, and how much financial flexibility remains. After all, sustainable growth is ultimately reflected in the cash flow it generates for shareholders.
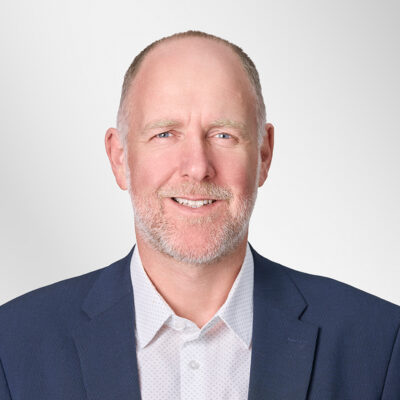
Contact: Stefan Schütz, Head of Equity Research, s.schuetz@tareno.ch
Publisher: Tareno AG, Gartenstrasse 56, 4052 Basel, Tel. +41 61 282 28 00, info@tareno.ch, www.tareno.ch. We welcome feedback on our publication. The content herein is provided for informational purposes only. This publication does not contain legal or investment advice or investment recommendations, nor does it constitute an offer or a solicitation to make an investment. Images / Charts: The charts were prepared by Tareno AG using publicly available market data.
Do you have any questions on this topic?
Our portfolio management team will be happy to provide you with explanations and clarifications.
Find out more about us
Asset management
Publications